I’ve been keeping track of my writing submissions, rejections, and acceptances in a fancy little notebook for the past three years.

Fancy notebook
In a private Facebook group, I recently participated in a discussion about how much money other full-time freelancers make annually. Many of them are doing full-time journalism and copywriting and not trying to make it as fiction writers. While I keep track of my financials, I was inspired by this discussion to analyze the volume and success rate of my pitching.
So I launched into the analysis of my submissions, rejections, and acceptances. Now, even though someone I love very, very much is like and expert on Numbers, charts, and graphs, I’m not so much of an expert. So I started out very simply with a numeric chart. Later I might try pie charts and bar graphs. Also, later I might analyze my non-fiction versus fiction rates. But at this point, here are my basic numbers.
One of the hardest tasks I had in making these charts was choosing a color for each year. I don’t exactly have an eye for design, so I decided to use the Pantone colors of the year!

2013 Submissions
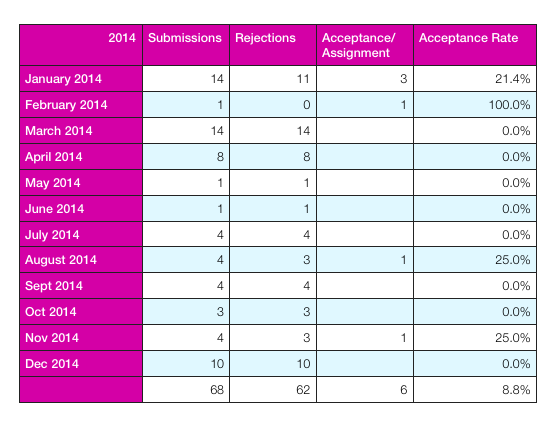
2014 Submissions
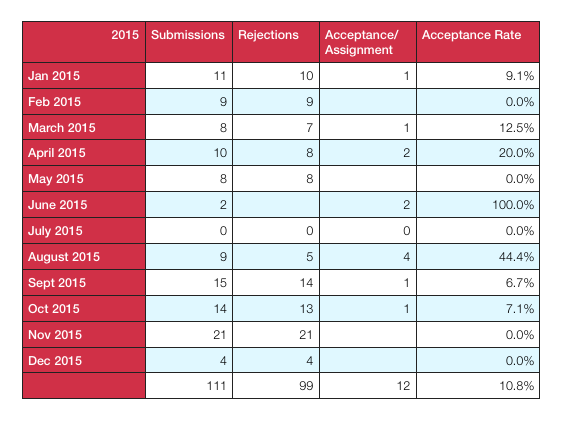
2015 Submissions

2016 Submissions – will this be the year I submit over the summer?
So it looks like 2015 was a good year in terms of overall volume. I did better on my amount of submissions and, probably logically, did better in terms of acceptances. There’s also a definite bell curve in terms of what time of year I am most productive with submissions.
For 2016, I hope to maintain a steady rate of submissions even over the summer. I’d also love to hit at least 10% of acceptances for the year.
Do you keep track of your submissions, rejections, and acceptances? Have you ever analyzed your success rate?